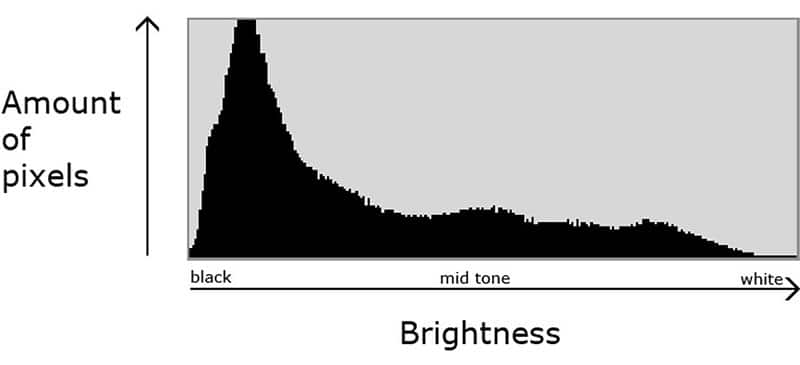
Part 5: Understanding The Camera Histogram
Many photographic enthusiasts have discovered the value of reviewing the histogram whilst working in the field. The histogram is the graph of the tonal range which one can make visible when reviewing your photographs on the camera. By Peter Wickham.
The first step is to know how to see the historgram graph next to the photo being reviewed in the viewfinder. To do this, select a photo stored on your camera’s flash drive and view it in the LCD monitor.
Next, find a button marked ‘INFO’ or ‘DISPLAY’. If your camera does not have one of these buttons then you may need to refer to your camera’s instruction manual to ascertain how to display your histogram on the LCD screen when reviewing photos.
In this article, we will be working with the black and white histogram and not those represented in red, green and blue.
Next, you need to know what the Histogram actually does. The histogram displays the tonal range of the shot being reviewed in graphical terms. The tonal range is between the numerical values of 0 to 255 with zero being black (absence of any light) and 255 being pure white (full recordable amount of white).
One will note that the values towards the left of the graph represent the darker tones, whilst those towards the right, represent the lighter tones. The tonal range recorded between these two sectors represents the mid-tones.
Generally, a photograph will have tones across the spectrum, however, if the scene being photographed has no black or white components, then we would expect a gap on either the right of the graph (absence of white) or on the left (absence of black).
The absence of black occurs more frequently than does the absence of white, and therefore one should be concerned if a gap exists on the right of the graph, indicating that the image is underexposed (the image needs more light to be allowed into the camera). Whist it may occur that there are gaps on either side of the histogram, these instances are rare, and if the gap is on the left, it usually means that the image is over-exposed (too much light is allowed into the camera).
Remember that you are in control of exposure settings, and within parameters, can either lengthen or shorten the time that the shutter stays open (shutter speed), open or close the lens aperture (lower number = wider aperture, higher number = smaller aperture), or increase or decrease the sensitivity of the sensor with the ISO setting, with due consideration that higher ISO settings result in graininess to a greater or lesser extent in your photograph.
Contrary to popular belief, nobody can tell you what the ‘ideal’ or ‘perfect’ histogram should look like, as each scene will determine a different tonal range. It is up to the photographer to determine that if the scene is generally bright, that the histogram will reflect this as being heavy on the right side of the graph and the opposite if the scene is largely dark.
One should only accept “cliff face” drops on the left or right of the histogram if one intends to clip the blacks or whites in the image (clipping means that the tonal range is unable to determine the extent of blacks or whites in the image and will then clip any further tonal range which might be available, to the tonal range reflected in the graph i.e. 0 – 255).
If clipping does occur, then generally that detail in the clipped sectors is lost and will show on the image as pure white or pure black.
In closing, the only way to get used to the histogram is through trial and error. Practice makes perfect as they say.

Read more on this series:
- Part 1: Capturing the Golden Hour
- Part 2: Depth Of Field
- Part 3: Exposure
- Part 4: Focus, Lighting & Background


